
|
|
 |
| Home | Topics Research | Publications | Collaborations | Contact Us | People | Links |
|
|
Micro CT


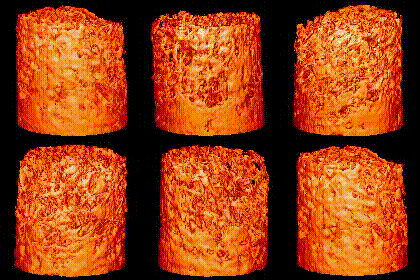 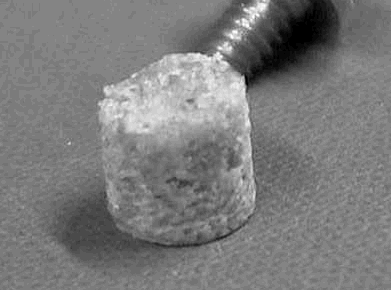 CT analysis of an animal bone sample With collaboration of ENI The specimen features: diameter 7.1 mm height 6.99 mm Parameters: angular steps: 720 voxel side: 27 µm |
The sample considered for preliminary test of micro-CT system is a pig bone specimen extracted from the proximal part of the femur. The object has a cylinder shape of size 7.1 mm (Ø) x 6.99 mm (h) and has been previously submitted to a dryingtreatment for allowing also NMR tests. The specimen presents a clear trabecular structure over all the volume with a cortical region in one of the extremities corresponding to the extraction point. The X-ray tube has been set with a molybdenum anode at 30 kV, 0.5 mAs with an aluminum filter of about 0.5 mm. The source-detector distance was 17 cm with an object magnification of 1.1. The tomographic analysis of the sample has been carried out by measuring 720 radiographic projections over 360° with an angular sampling of 0.5°. Therefore, the radiographic data-set consists of about 700 Mb then reconstructed on 320 slices of 400x400 pixels by means of Feldkamp algorithm7. The CT voxel size is 27 microns. A radiographic projection of the sample is reported in Figure 4; the trabecular structure is clearly evident as well as the cortical component in the lower part of the sample. On the other hand, the superimposition in the radiographic image of the various layers of the object prevents the opportunity to extract quantitative information about size, shape and direction of different trabecular elements.
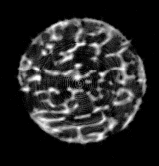
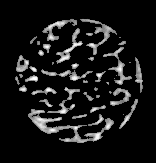
Figures (left) show a CT reconstructed image of the bone. The cancellous composition and its geometrical distribution are now simply detectable as well as the marrow among the bone. In order to allow a detailed analysis of the bony component, a segmentation of the data-set has been applied to remove the marrow. The segmentation process is a crucial point of the morphometric procedure and it shall be described in detail in the next section.
CT slice of the pig bone sample extracted in the mid-position of the inspected volume. (left): original slice with tissue visible inside the trabecular structure. (right): same slice after segmentation for bone data selection.
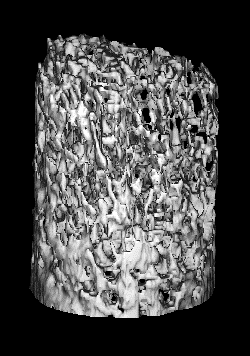
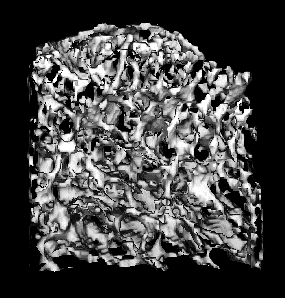 Then, all the slices were packed and the volume obtained was displayed by means of rendering techniques. Figures show a 3D visualization of part of the data-set (left) and the geometrical extraction of a region-of-interest (right) in order to show the inner parts of the specimen. The trabecular structure is manifest and clearly displayed. In this way, a complete qualitative analysis of the bone can be carried out quickly to assess the status of the sample and results can be integrated with biomedical information.
Extraction and display of parts of the data-set (Figures belowe) can be optimized to obtain a sort of zoom of details; the high spatial resolution of CT results allows to obtain the extraction and visualization of single trabecular elements. Next section describes the procedure adopted for the real extraction and analysis of trabeculae and for measurements of morphometric parameters.
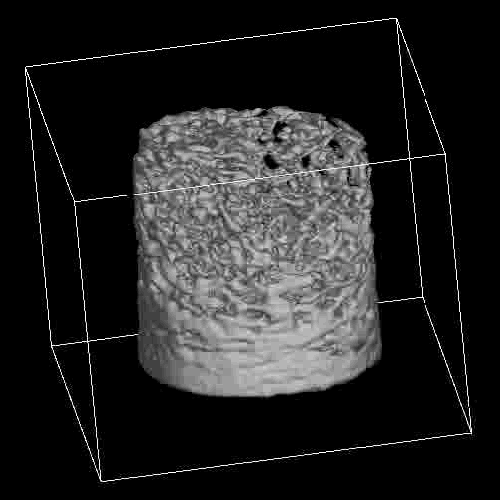
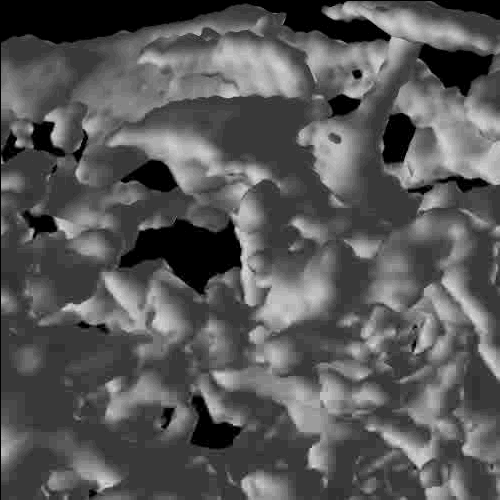
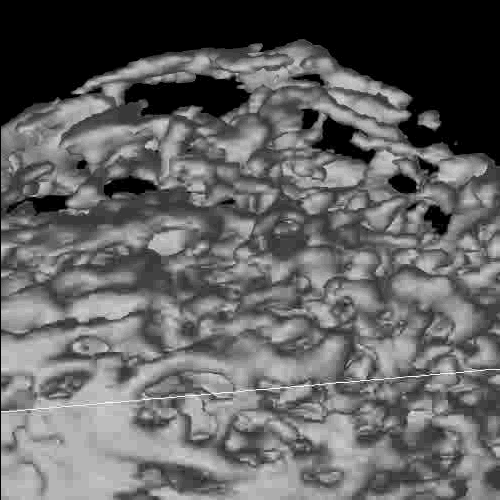
It must be remarked that the high spatial resolution of the CT system offers the opportunity to obtain images of single trabecular elements.
Webmaster: Rosa
Brancaccio